
Which Renishaw Raman Spectrometer Is Best to Buy in 2026?

Choosing a Renishaw Raman spectrometer in 2026 is less about finding a universal winner than matching an instrument to real samples. A polished crystal, a layered semiconductor, and a pharmaceutical tablet place different demands on optics, mapping, and workflow. There is no universal winner.

Grand View Research’s Raman Spectroscopy Market Size, Share & Trends Analysis Report estimated the global market at USD 1.06 billion in 2023 and projected a 9.2% compound annual growth rate from 2024 to 2030. That growth signals wider adoption, not a guarantee that every laboratory needs the most elaborate configuration. Buyers should compare the Renishaw inVia family and other suitable models against sample type, required spatial resolution, mapping area, fluorescence risk, and operator experience. A tiny inclusion under a microscope is not the same job as screening many samples each day.

This guide focuses on practical trade-offs: research flexibility, automated measurement, software, service, and total cost of ownership. Product specifications and configurations can change, so verify current details with Renishaw and request a demonstration using representative samples. One honest limitation: published specifications cannot predict every sample’s fluorescence or heating behavior. Test your own material, if possible. A careful comparison may feel slower, but it can prevent an expensive mismatch.
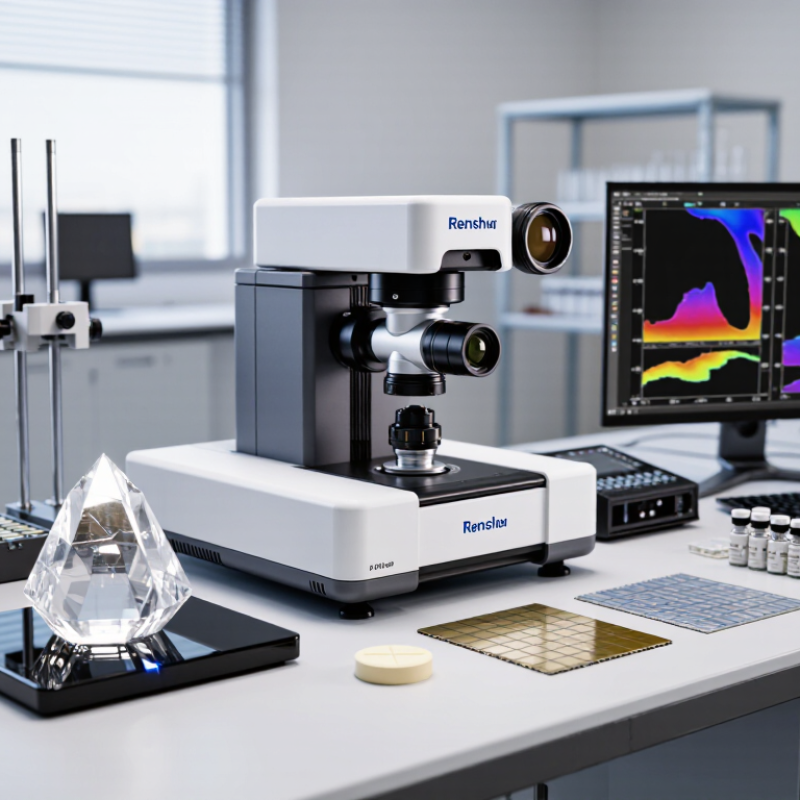
Which Renishaw Raman Spectrometer Is Best to Buy in 2026?

How Renishaw Raman Spectrometers Work

How Raman Spectrometers Work

A Raman spectrometer shines a laser onto a sample and measures the small fraction of light that scatters with a changed energy. That energy difference forms a spectrum, often shown as peaks against Raman shift in cm⁻¹. Each peak reflects molecular vibrations, helping analysts distinguish materials or inspect changes in a sample. It is a useful fingerprint, not a magic answer. Fluorescence, dirty surfaces, and uneven focus can obscure weak peaks.

The measurement path is simple in principle: laser, sample, collection optics, filter, and detector. A notch or edge filter rejects intense laser light so the detector can capture weaker Raman signals. Calibration matters. ASTM E1840 lists polystyrene’s peak near 1001.4 cm⁻¹ as a Raman-shift reference. For intensity response, NIST SRM 2242 is designed for systems using 785 nm excitation. These references help check different parts of instrument performance; neither guarantees a good result on every sample.

Tips: Start with a clean sample and a stable focus. Record the laser wavelength, integration time, and calibration check with each measurement. If a peak looks unexpected, repeat the scan at another spot. Small differences can come from sample texture, not chemistry. Calibration is easy to postpone. That is a mistake.

Renishaw Raman Spectrometer Families and Key Differences

Raman spectrometer families differ mainly in where and how they collect data. A confocal research microscope suits users who need fine spatial detail, flexible laser options, and analysis of small areas. It can reveal subtle changes across a crystal, coating, or cell sample. The trade-off is a more demanding setup and a steeper learning curve. Small details matter.

Automated analytical systems are designed for repeatable measurements across many samples. Their mapped results can help compare batches or locate uneven ingredients, with less dependence on manual positioning. Compact instruments prioritize mobility and quick checks, but may offer fewer options for microscopy or advanced mapping. These are different tools, not simple tiers of one product. For 2026, compare the sample types, required spatial resolution, available lasers, software workflow, and service support before choosing. Ask for a demonstration using material similar to yours; a polished brochure cannot show how an instrument handles a rough surface or weak signal. It is easy to overvalue headline resolution. In practice, ease of calibration and reliable day-to-day results may matter more, though that balance depends on the lab.

Which Raman Spectrometer Configuration Is Best to Buy in 2026? — Raman Spectrometer Families and Key Differences

Instrument family Best suited to Typical configuration Key advantages Main trade-offs What to check before buying
Research-grade confocal Raman microscope Detailed material identification, microscopic mapping, and analysis of small or layered samples. Microscope-coupled optics; often supports several laser wavelengths, objectives, and mapping options. High spatial selectivity; supports point analysis, depth profiling, and chemical imaging. Higher cost and greater setup complexity; measurements can be affected by fluorescence, sample heating, or focus stability. Available laser wavelengths, objective compatibility, confocal performance, mapping speed, spectral range, and user training needs.
Routine laboratory Raman microscope Quality control, routine identification, and teaching or service laboratories. Microscope-based system with a standard set of excitation options and automated measurement workflows. Balances sample access, repeatability, and ease of operation for common laboratory tasks. May offer fewer configuration choices or less flexibility for specialized experiments than a research-focused system. Sample-holder options, automation, reference-library workflow, software licensing, and the upgrade path.
Compact benchtop Raman analyzer Fast screening and routine checks where a full research microscope is unnecessary. Integrated optical and detector package; commonly designed for a defined range of sample types and workflows. Small footprint and straightforward operation; can reduce setup time for routine measurements. Typically less flexible for custom microscopy, specialized sampling, or advanced spatial mapping. Whether it measures the required sample forms, supports the needed wavelength, and provides suitable spectral resolution and software tools.
Portable or handheld Raman analyzer Identification and screening in the field, warehouse, or production environment. Battery-powered or portable unit with a built-in probe or sampling interface. Enables measurements away from a laboratory and supports rapid on-site decisions. Performance can be limited by sample geometry, ambient conditions, fluorescence, and the need to measure through packaging. Battery life, environmental rating, measurement time, safety features, library coverage, and performance on the actual sample packaging.
Process Raman system Continuous or repeated monitoring in manufacturing, process development, and reaction studies. Analyzer connected to a sampling probe or process interface; may support remote or automated acquisition. Can provide measurements during a process and reduce the need to collect samples for separate laboratory analysis. Requires suitable probe placement, process integration, calibration strategy, and maintenance planning. Probe material compatibility, operating temperature and pressure limits, response time, data integration, and validation requirements.
Specialized low-wavenumber Raman system Materials whose relevant Raman features occur close to the laser line, including some lattice and crystalline vibrations. System configured with suitable filters and optical components to access lower Raman shifts. Can reveal spectral features that standard configurations may not capture effectively. Specialized configuration may add cost and is not necessary for many routine identification tasks. Verified low-wavenumber limit, filter performance, laser wavelength, and whether the target features are within the instrument’s measured range.

Buying note: Raman performance depends on the complete configuration, sample, and measurement conditions. Common excitation wavelengths include 532 nm, 633 nm, 785 nm, and 1064 nm; the best choice depends on fluorescence, sample sensitivity, signal strength, and the required spectral range. Confirm specifications and suitability with measurements on representative samples.

Factors to Consider When Choosing a Renishaw Raman System

Choosing a Raman system starts with the sample, not the brochure. A 2024 Raman spectroscopy market report estimated the global market at about USD 1 billion in 2023, reflecting demand across research and industrial analysis. That growth does not make every configuration suitable. Check excitation wavelength against sample fluorescence, then compare spectral resolution and sensitivity using materials similar to yours. Small details matter. Ask for raw spectra, not only polished demonstrations.

For routine identification, a compact microscope may be enough. Mapping needs stable focus, repeatable stage movement, and software that handles large datasets without slowing the workflow. If samples vary in size, inspect working distance and enclosure clearance in person. A spec sheet can still mislead. Request a measured test on a representative sample, including acquisition time and signal quality. Also compare detector options, calibration support, training, service response, and the full cost of ownership. I would leave room for uncertainty: sample preparation and operator habits can change results as much as the instrument itself.

Which Raman Excitation Wavelength Should You Consider in 2026?

Common excitation wavelengths used in Raman spectroscopy

These are representative wavelengths used in Raman spectroscopy, not a ranking or a list of options offered by any particular manufacturer. The best choice depends on sample fluorescence, absorption, desired Raman signal, and detector compatibility. Longer-wavelength excitation can reduce fluorescence for some samples, while wavelength choice should always be validated with the material being measured.

Matching Renishaw Raman Spectrometers to Research Applications

Matching a Raman spectrometer to research begins with the sample, not a product label. For routine identification of powders or liquids, a compact instrument with a library and stable calibration may be enough. Microscopic mapping of coatings, cells, or mineral grains calls for an imaging system, precise stage control, and suitable laser options. For fluorescent samples, excitation wavelength matters; a longer wavelength can reduce fluorescence, though it may also produce a weaker Raman signal. Small trade-offs add up.

The 2024 Grand View Research report estimated the global Raman spectroscopy market at about US$1.2 billion in 2023, with projected growth through 2030. That signals expanding use, not proof that one instrument suits every lab.

Ask vendors for spectra from samples like yours, under your expected acquisition times. Check spatial resolution, spectral range, calibration workflow, and service access. Then test the system with your own reference materials. A neat brochure spectrum can be misleading. I would also record failed measurements; they reveal limits that a polished demonstration may hide.

How to Select the Best Renishaw Raman Spectrometer to Buy in 2026

Choosing a Raman spectrometer for 2026 starts with the samples, not the feature list. Ask whether you will examine powders, thin films, liquids, or finished components. A microscope helps with small regions; a mapping stage matters when chemical variation across a surface is important. If samples fluoresce, compare laser options using representative materials before committing.

Check the practical details. Can the instrument fit your workspace, connect to existing software, and support the accessories your lab uses? Compare spectral range, resolution, detector performance, and safety controls against your actual measurements. Ask for a demonstration with a sample similar to yours. A clean reference spectrum can look reassuring, but it may not reveal weak signals, fluorescence, or focus problems in everyday work.

Budget for more than the instrument. Include installation, training, calibration checks, maintenance, and future service access. I would not choose solely by the highest resolution; that specification may add little value for routine identification. Nor is the cheapest configuration automatically economical if it cannot handle your sample size. Some uncertainty remains until you test real specimens. Keep notes on acquisition time, repeatability, and operator effort, then select the setup that performs reliably under those conditions.

preloader